Introduction
The world of trading is a fascinating blend of art and science, where patterns play a crucial role in predicting market movements. One such pattern that holds significant weight in technical analysis is the Bearish Head and Shoulders Pattern. In this blog post, we’ll unravel the intricacies of this bearish reversal pattern, exploring its formation, characteristics, and its implications for traders.
Understanding the Head and Shoulders Pattern
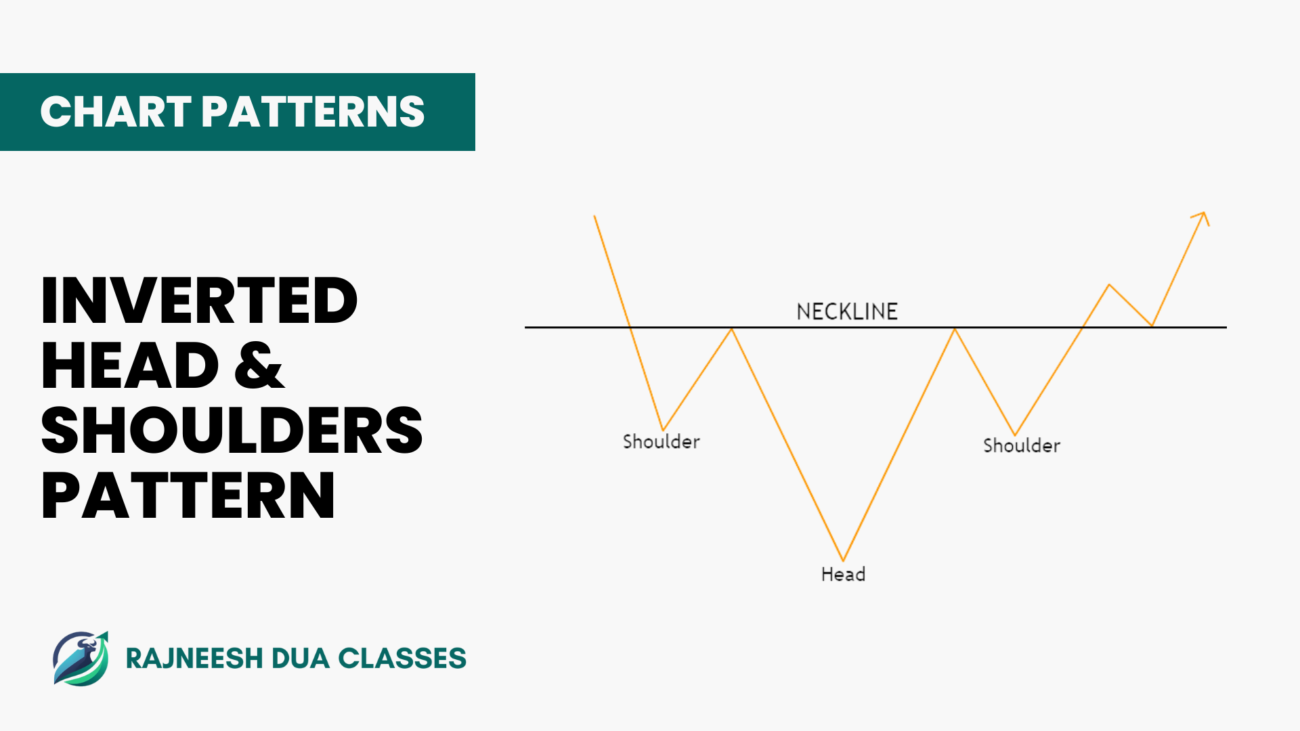
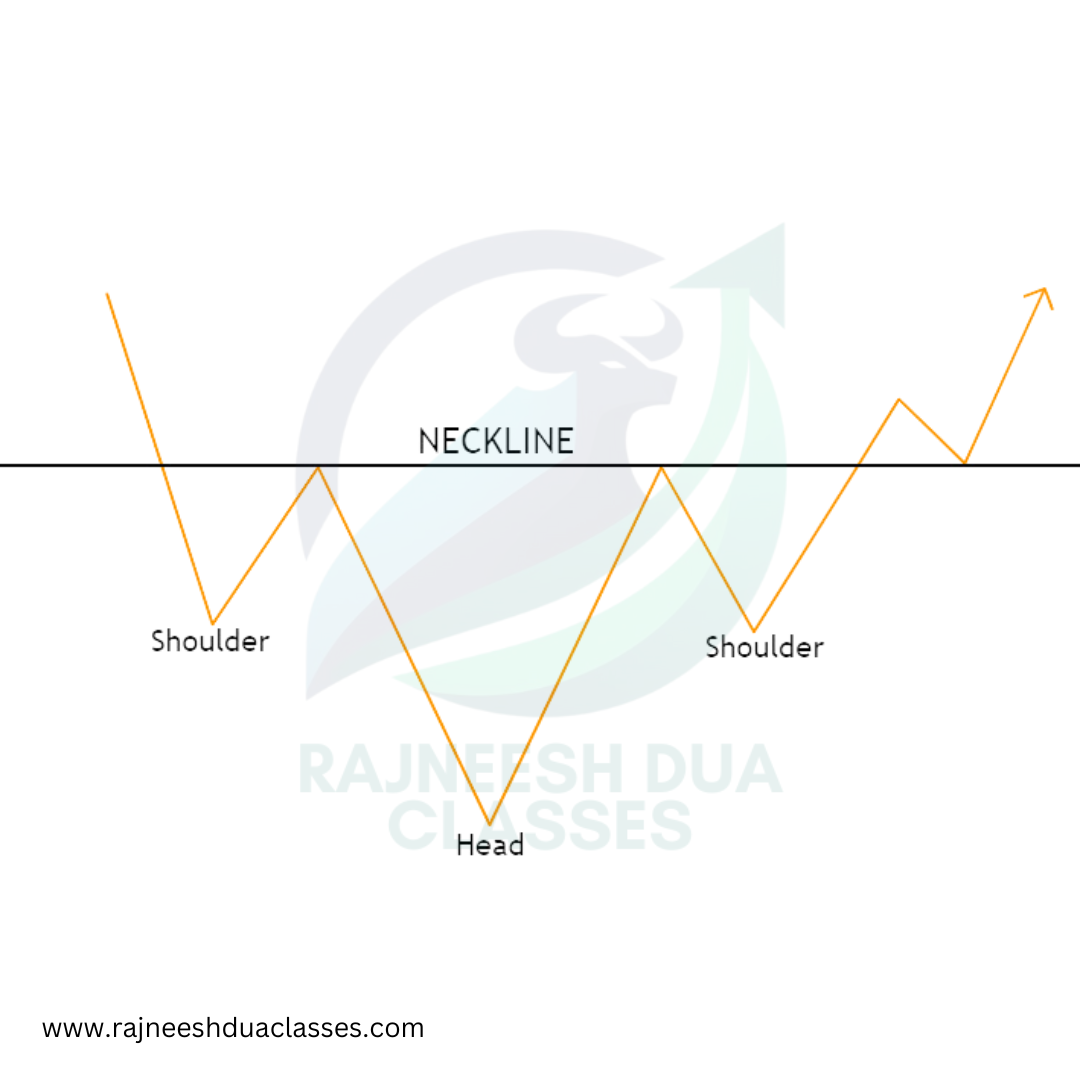
The Bearish Head and Shoulders Pattern is the pessimistic counterpart to the Inverted Head and Shoulders. While the latter signals a potential bullish reversal, the former warns of an impending bearish reversal. This pattern typically forms after an uptrend, indicating a shift in market sentiment from bullish to bearish.
Formation and Characteristics
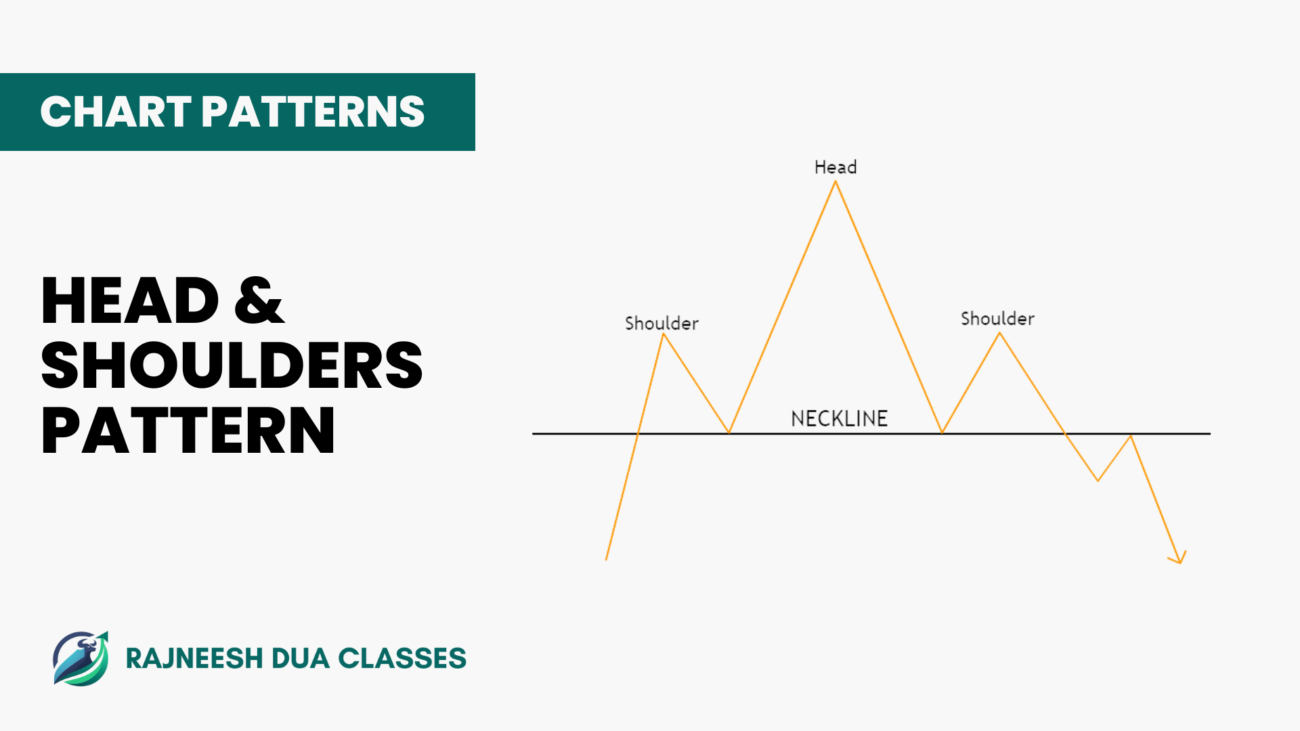
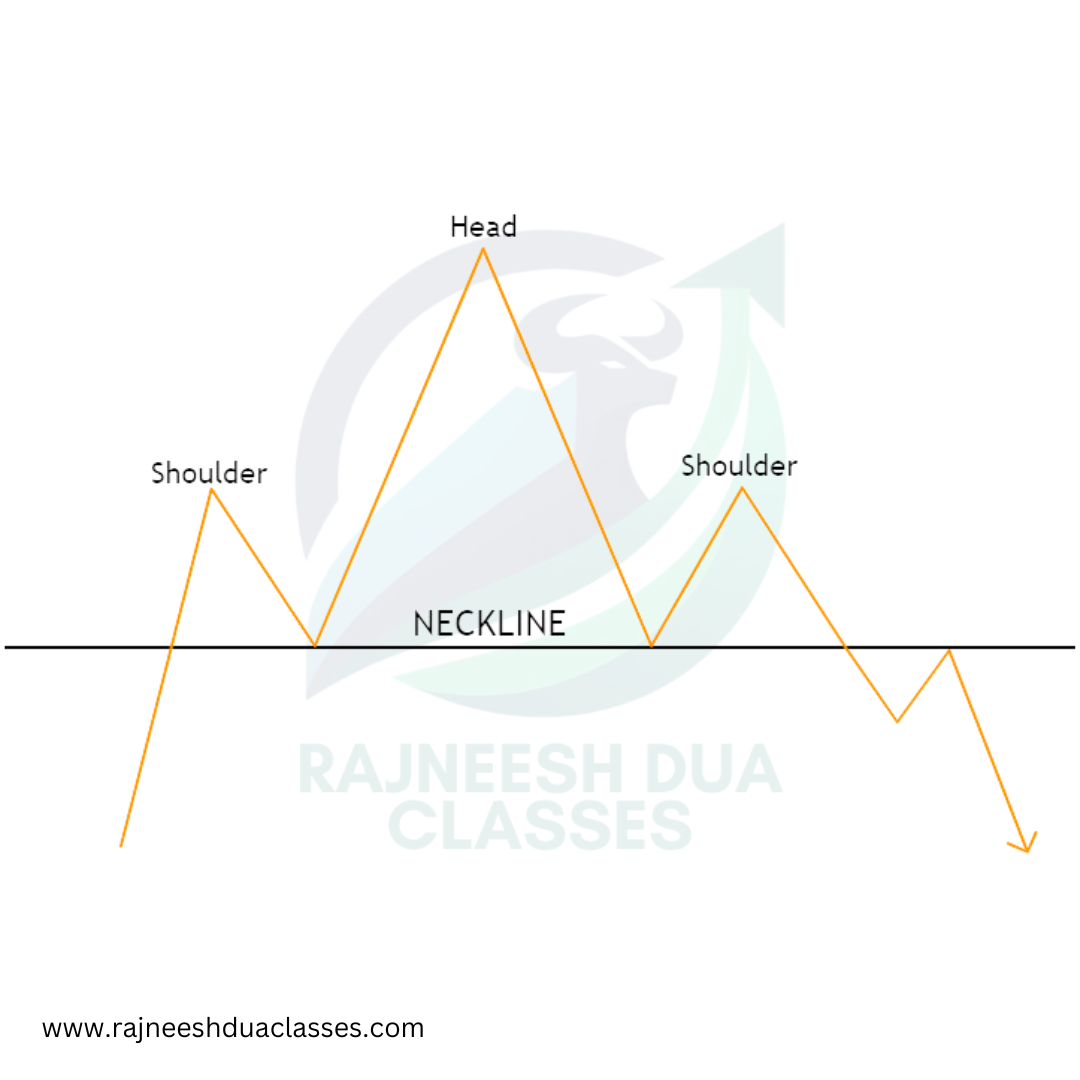
The pattern consists of three peaks – a higher high (head) between two lower highs (shoulders). The middle peak, or the head, is the highest point, forming an unmistakable ‘M’ shape. The shoulders, on either side of the head, are slightly lower in elevation and create a visual representation of a head and shoulders when plotted on a chart. The neckline, connecting the lows of the two shoulders, forms a horizontal line.
Interpreting the Head and Shoulders Pattern
Traders often watch for a breakdown below the neckline to confirm the bearish reversal. This breakdown is seen as a signal that the bullish trend is losing momentum, and a bearish market movement is likely to follow. Volume analysis is crucial during this phase, as a surge in volume during the breakdown adds credibility to the reversal. The distance from the head to the neckline can be used to estimate the potential downward move after the breakdown.
Risk Management
While the Bearish Head and Shoulders Pattern is a powerful indicator, effective risk management remains paramount. Traders should set stop-loss orders to limit potential losses if the market moves against their expectations. Additionally, it’s essential to consider broader market conditions, economic indicators, and other factors that may influence the accuracy of the pattern.
Examples:
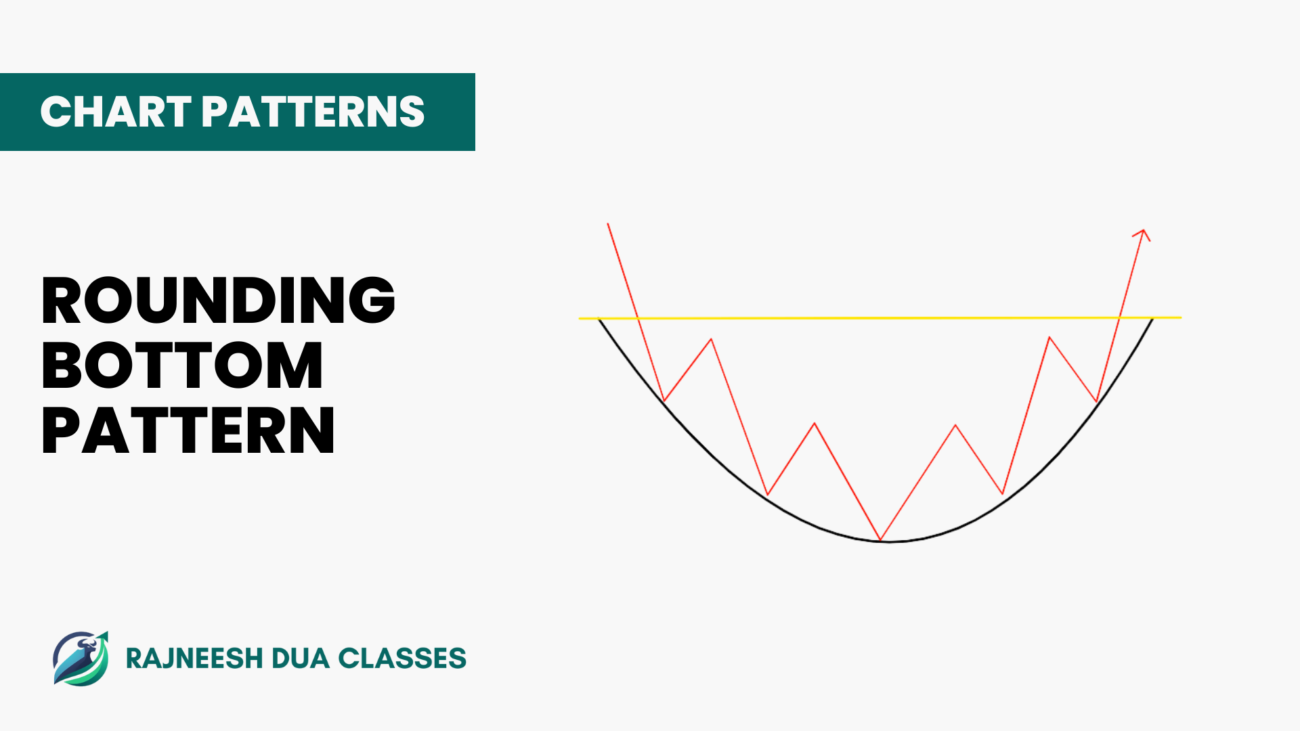
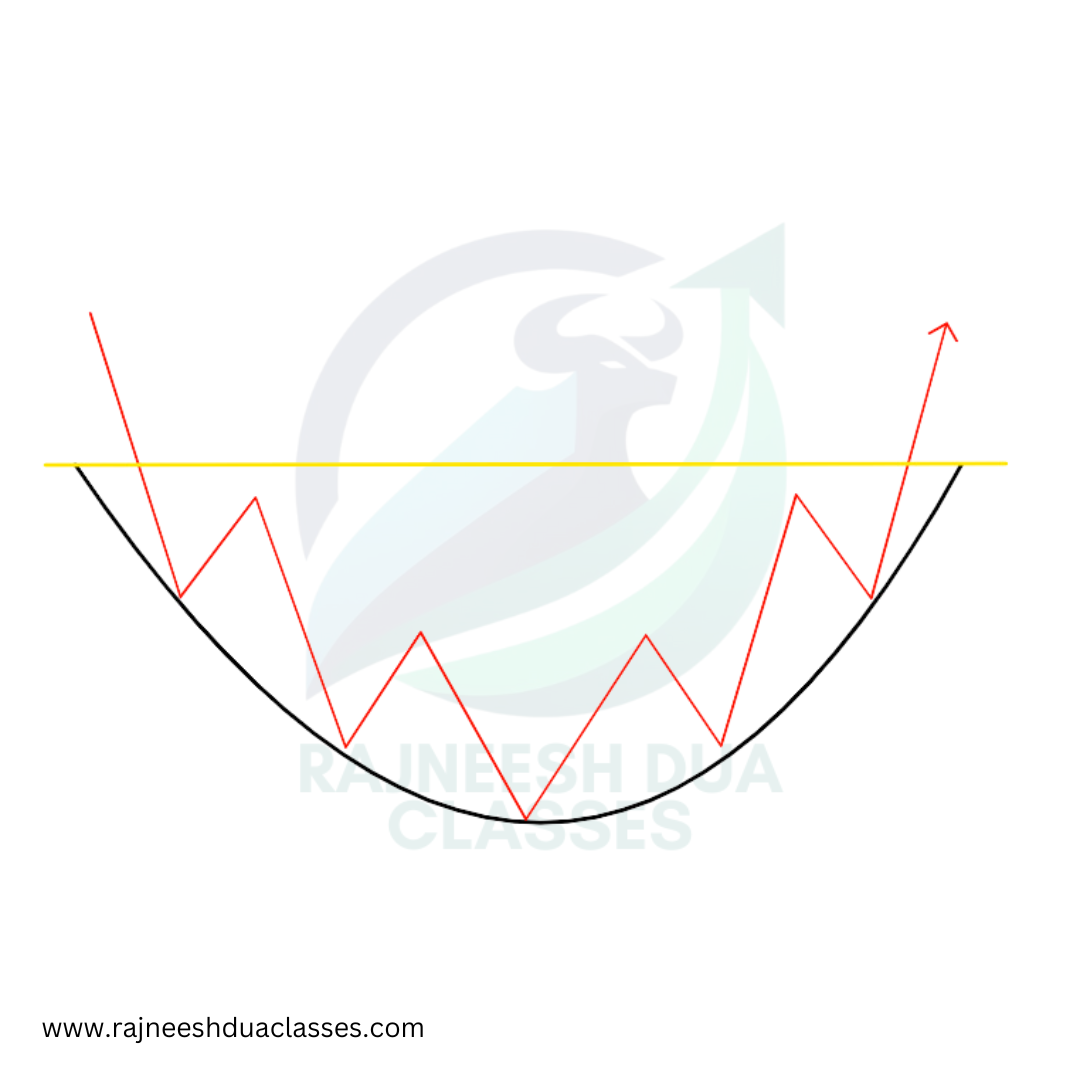
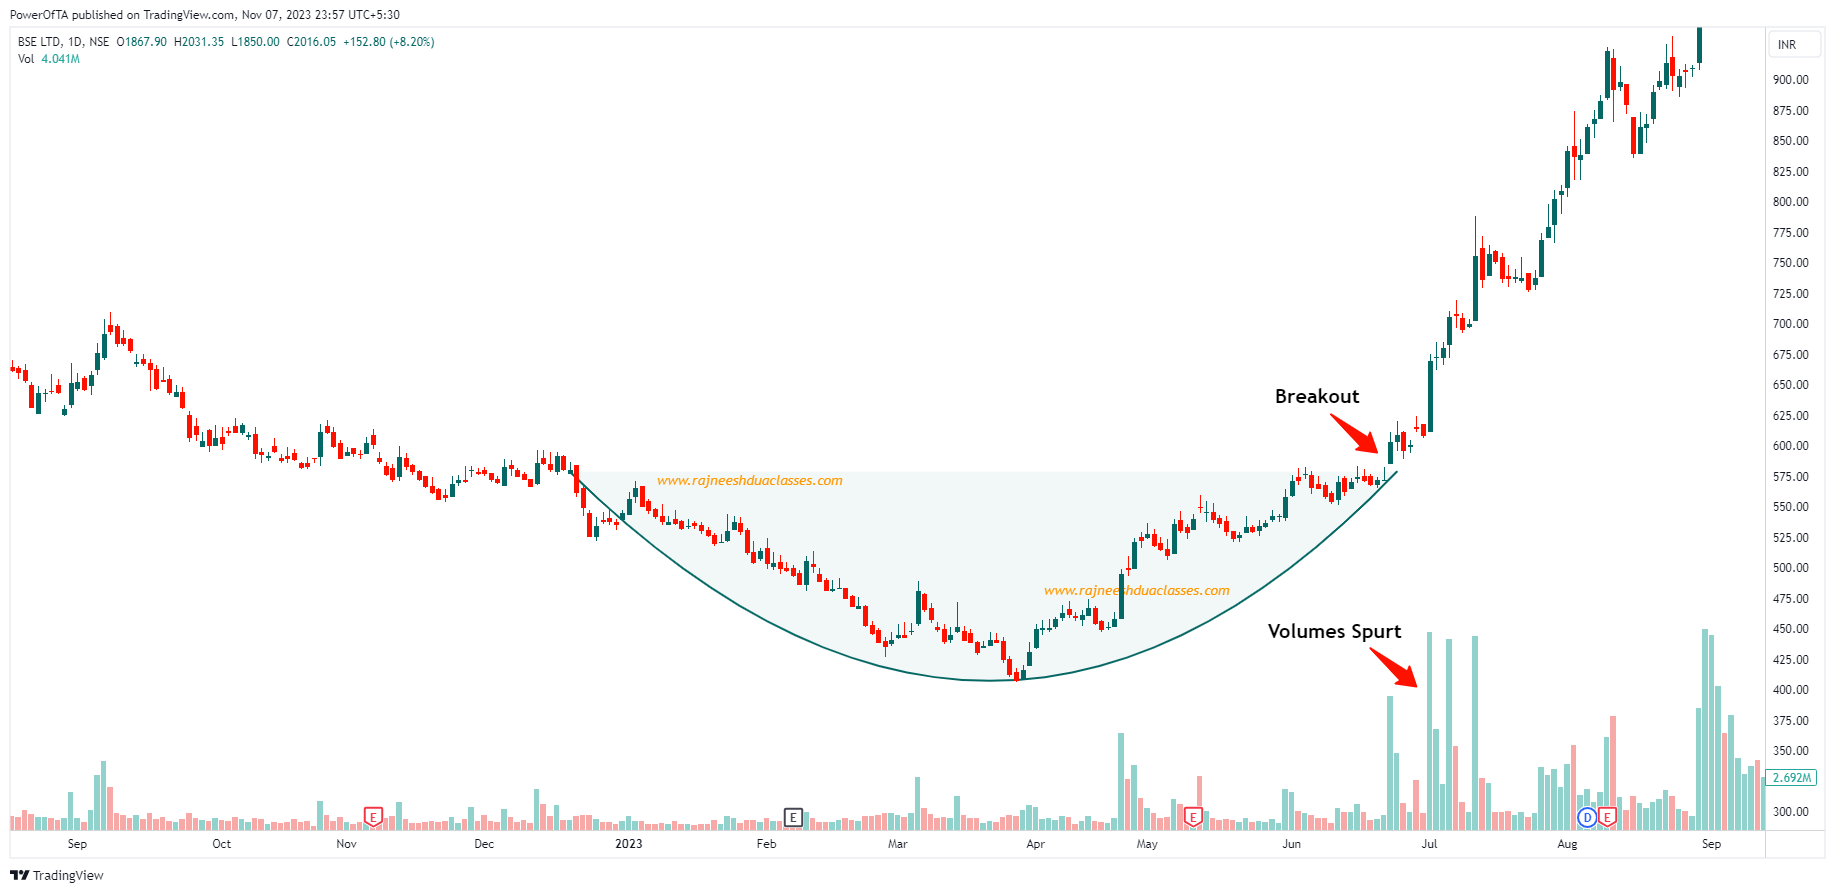
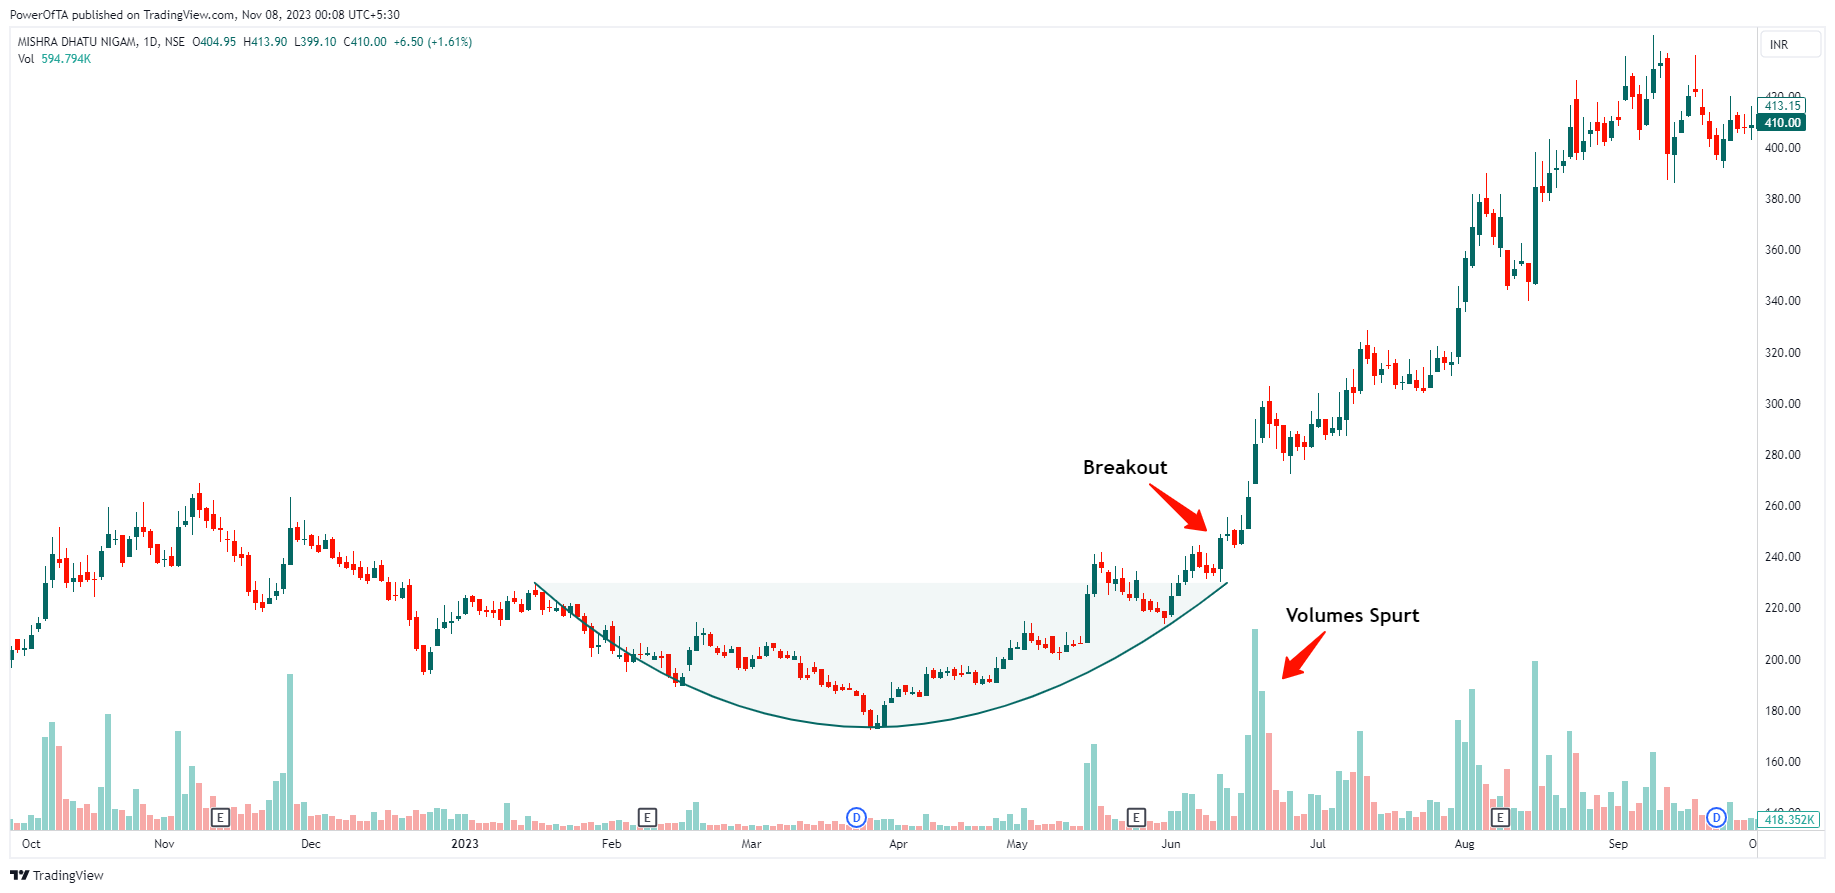
Let’s consider a hypothetical scenario where a stock has been in a downtrend for an extended period. The Rounding Bottom starts to form, indicating a potential trend reversal. Traders closely monitor the pattern, looking for a breakout above the resistance level with increased volume. Once the breakout is confirmed, traders may initiate long positions, expecting a bullish trend to follow.
#1 - BSE Ltd.
#2 - Century Textiles Ltd.

#3 - Midhani Ltd.
Conclusion
In the ever-evolving landscape of financial markets, traders armed with technical analysis patterns can navigate the complexities with greater precision. The Bearish Head and Shoulders Pattern, with its distinctive formation and characteristics, offers traders a valuable tool for identifying potential bearish reversals. However, like any trading strategy, it should be used in conjunction with other indicators and robust risk management practices to make well-informed decisions. By mastering the interpretation of patterns like the Bearish Head and Shoulders, traders can enhance their ability to anticipate market movements and position themselves strategically in the dynamic world of trading.