Introduction
In the dynamic world of financial markets, seasoned traders often rely on various technical analysis tools to decipher patterns and trends. One such intriguing pattern that frequently captures the attention of traders is the “Rounding Bottom Pattern.” This distinctive chart formation is not just a visual curiosity; it holds valuable insights into potential trend reversals and bullish market sentiments.
Understanding the Rounding Bottom:
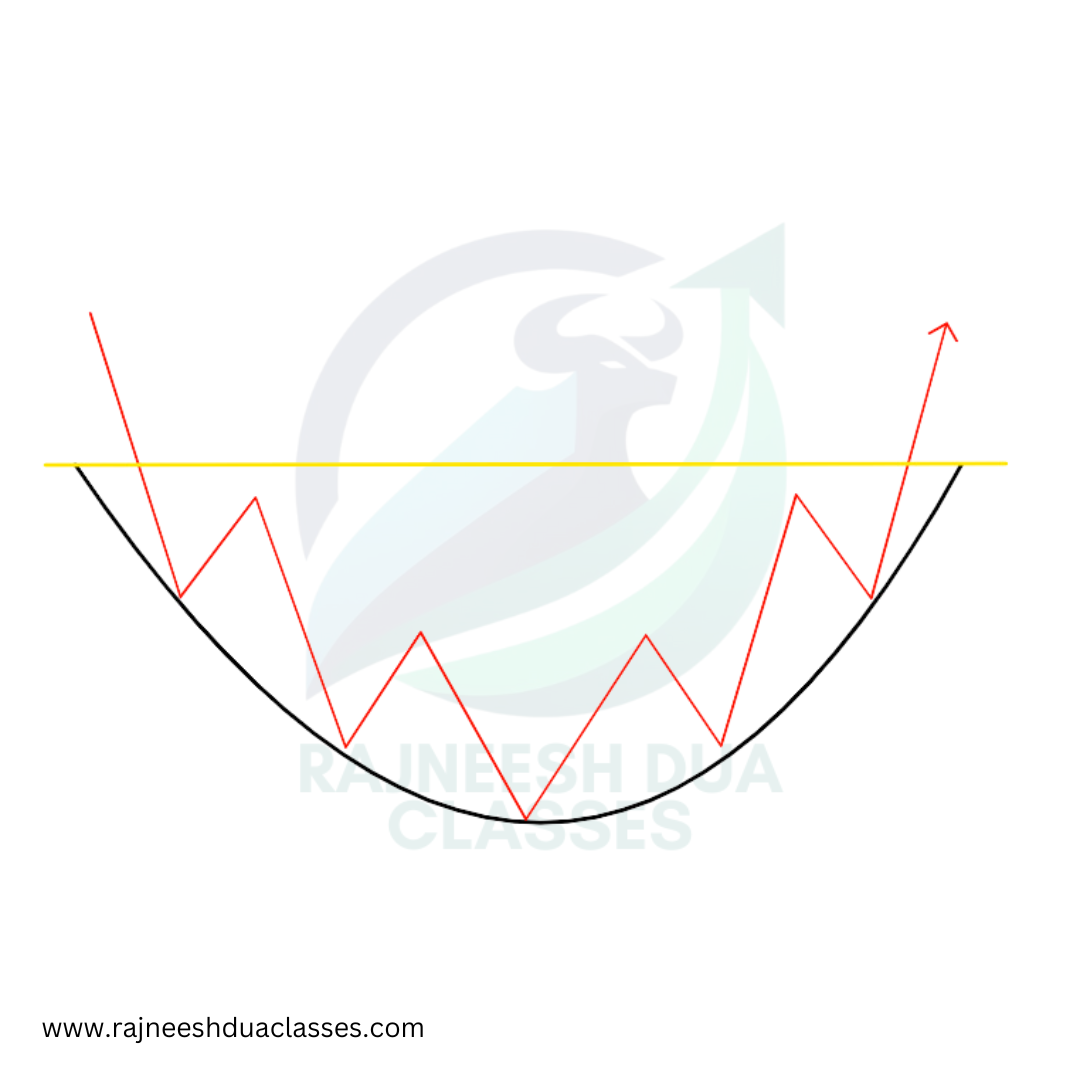
The Rounding Bottom Pattern, also known as the “saucer bottom” or “bowl,” is a reversal pattern that indicates a shift from a downtrend to an uptrend. Recognizable by its U-shaped curve on a price chart, this pattern suggests a gradual transition from bearish to bullish market sentiment.
Formation and Characteristics:
The formation of a Rounding Bottom typically begins with a prolonged downtrend, where the price experiences a series of lower lows. As the selling pressure subsides, the market starts to find support, forming the rounded bottom. The pattern is complete when the price breaks above the resistance level, confirming the reversal.
Key characteristics of the Rounding Bottom include a gradual and smooth curvature, resembling a bowl or saucer. The volume tends to decline during the formation of the pattern and increases when the price breaks out, validating the pattern’s strength.
Interpreting the Rounding Bottom:
Traders often use the Rounding Bottom as a signal to enter long positions, anticipating a potential uptrend. The pattern suggests a shift in market sentiment from bearish to bullish, as buyers gradually gain control. However, it’s crucial to confirm the pattern with other technical indicators and factors before making trading decisions.
Risk Management:
While the Rounding Bottom is a powerful reversal pattern, no trading strategy is foolproof. Traders should exercise caution and implement risk management practices. Setting stop-loss orders and diversifying portfolios can help mitigate potential losses in case the market doesn’t follow the anticipated reversal.
Examples:
Let’s consider a hypothetical scenario where a stock has been in a downtrend for an extended period. The Rounding Bottom starts to form, indicating a potential trend reversal. Traders closely monitor the pattern, looking for a breakout above the resistance level with increased volume. Once the breakout is confirmed, traders may initiate long positions, expecting a bullish trend to follow.
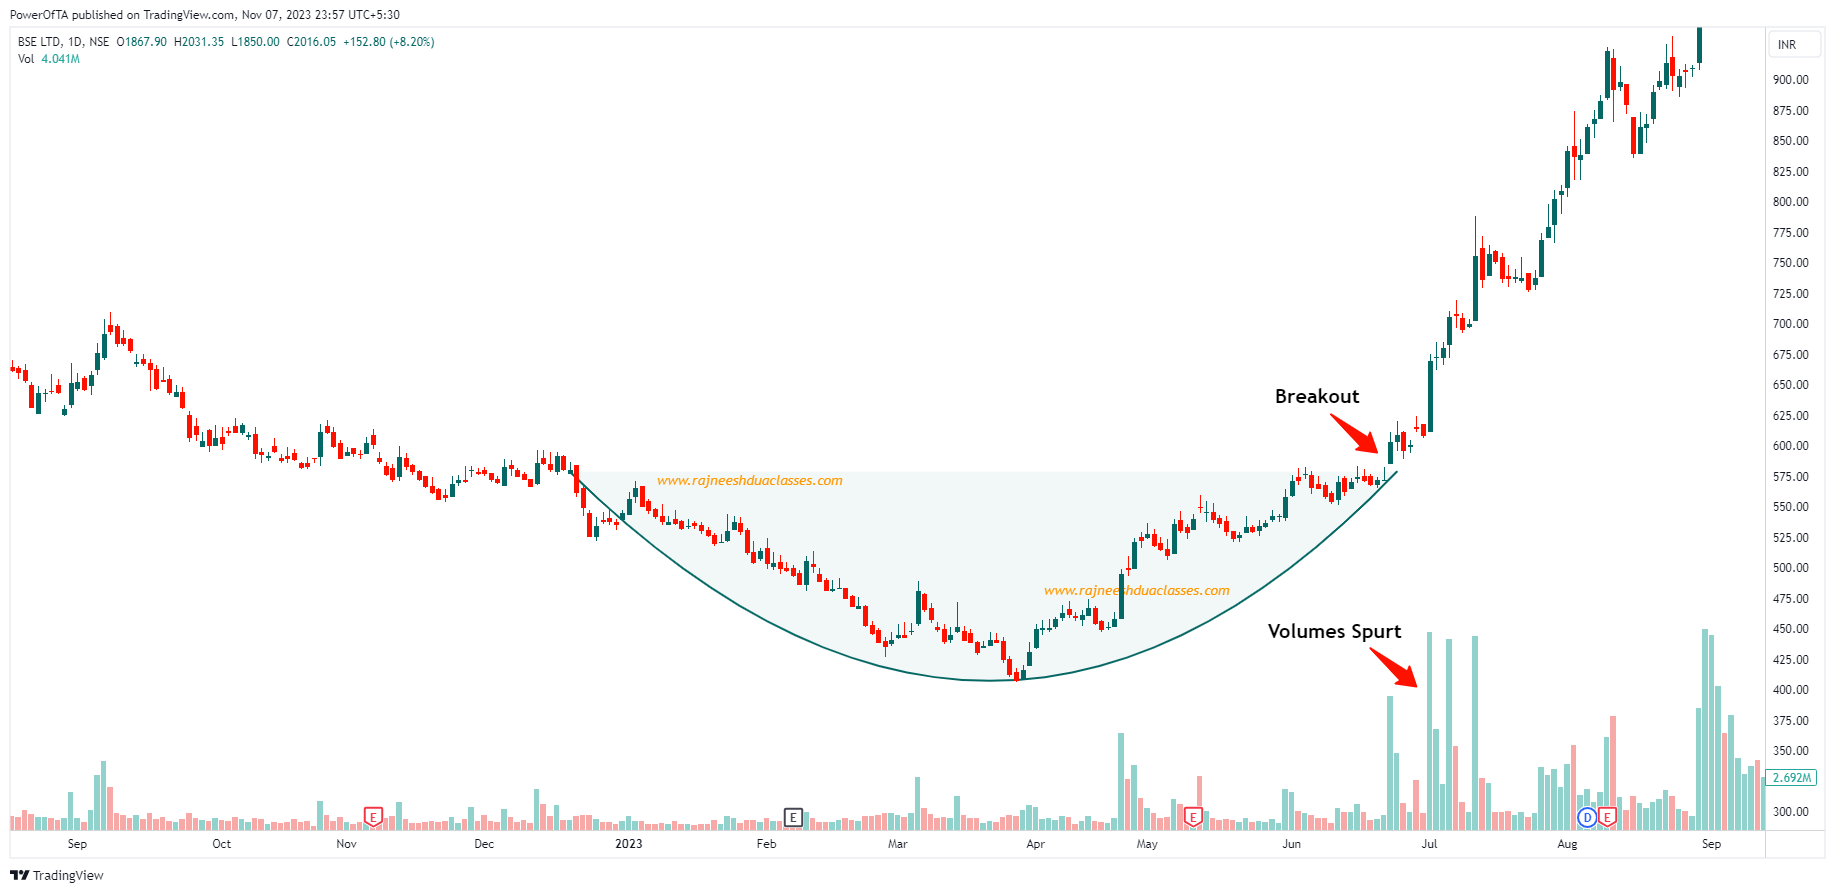
#1 - BSE Ltd.
#2 - Century Textiles Ltd.

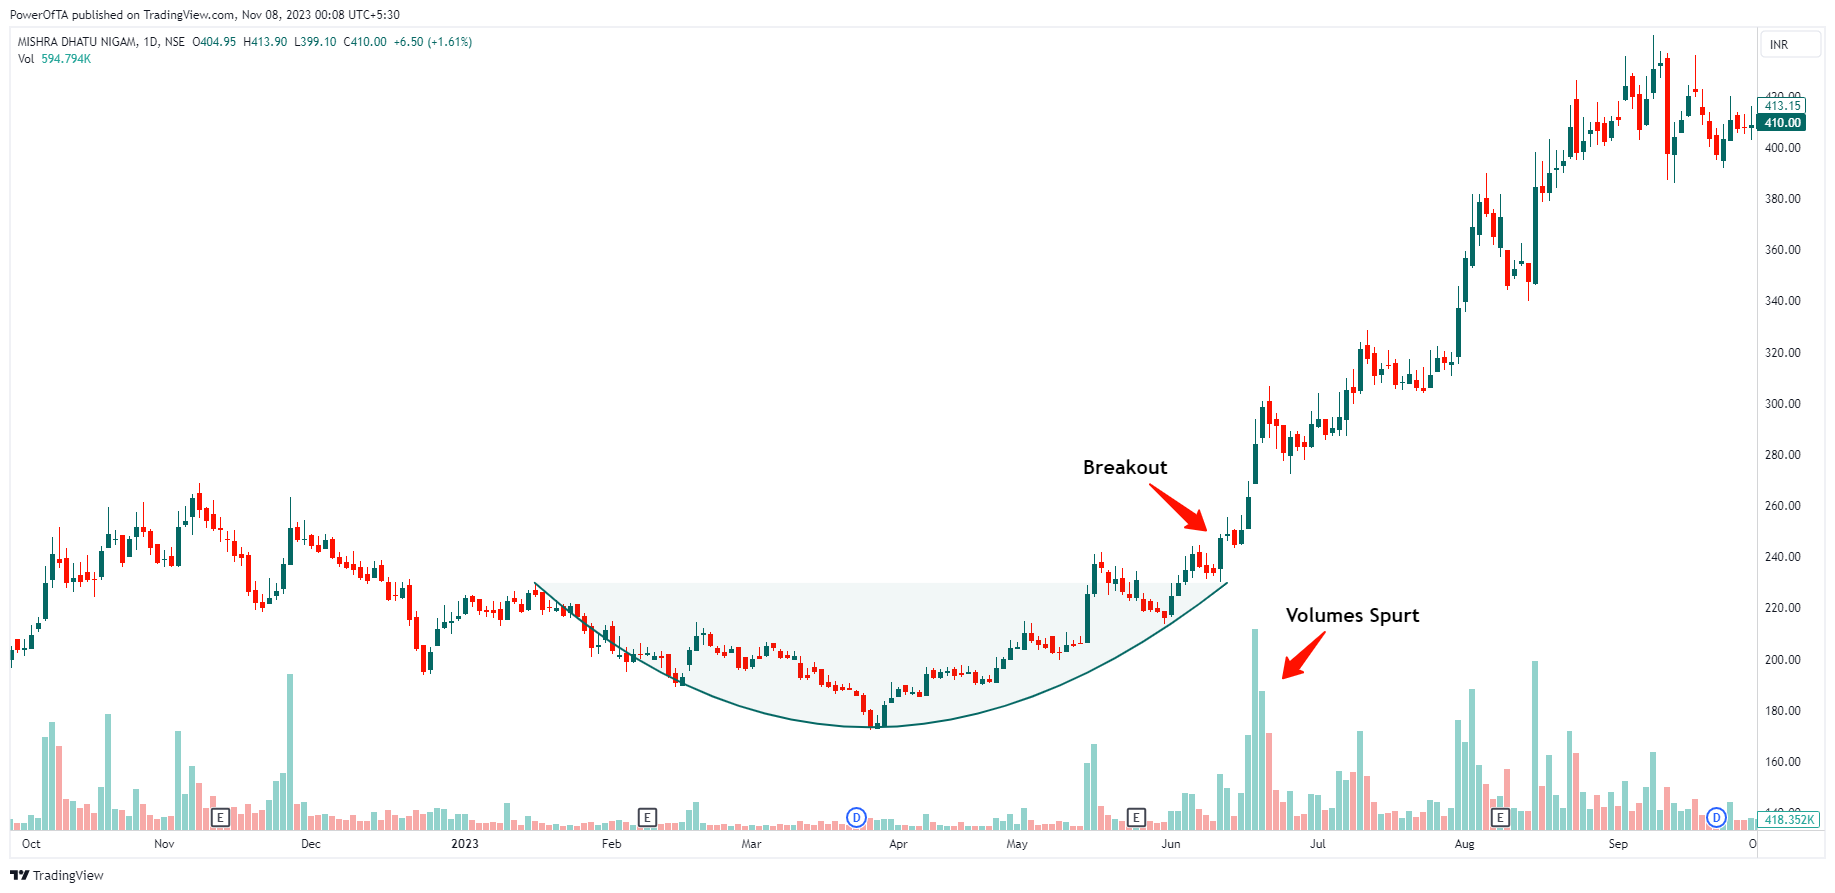
#3 - Midhani Ltd.
Conclusion
In the ever-evolving landscape of financial markets, chart patterns like the Rounding Bottom Pattern provide traders with valuable insights into potential trend reversals. Recognizing and understanding these patterns empower traders to make informed decisions and navigate the complexities of the market. While the Rounding Bottom is a compelling indicator, combining it with other technical analysis tools enhances its effectiveness, contributing to a more comprehensive and informed trading strategy.