Introduction
In the intricate realm of technical analysis, where traders seek to decipher the language of charts, patterns play a pivotal role. One such pattern that often captures the attention of seasoned analysts and novice traders alike is the Ascending Triangle Pattern. This geometric marvel is more than just a visual treat; it holds valuable insights into potential price movements.
Understanding the Ascending Triangle Pattern
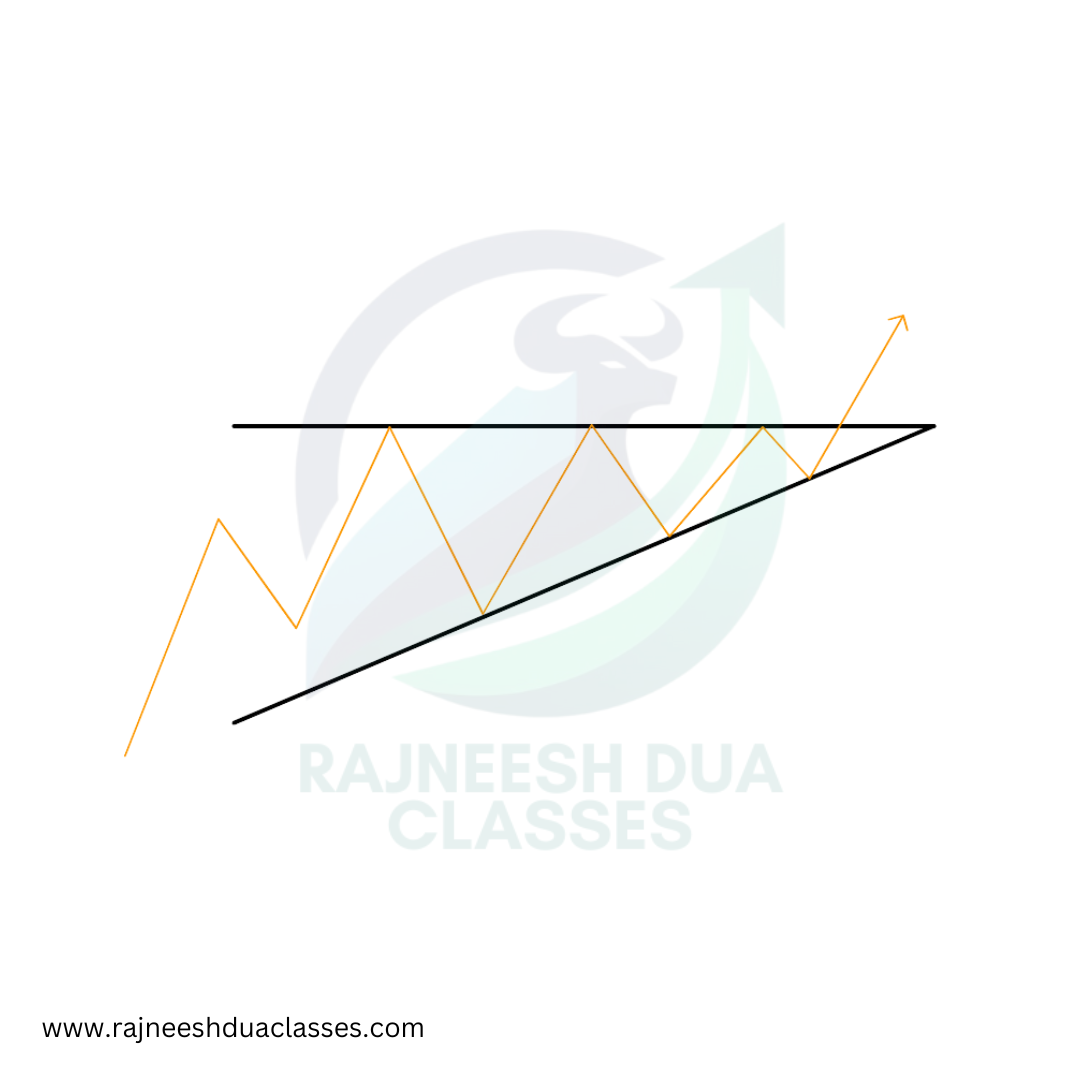
The Ascending Triangle Pattern is a bullish continuation pattern that typically forms during an uptrend. It is characterized by two trendlines—a horizontal resistance line and an ascending support line. The convergence of these lines creates a triangle shape, hence the name.
Traders keen on understanding market sentiment often find the Ascending Triangle Pattern to be a powerful tool. It suggests that despite intermittent selling pressure, buyers are consistently stepping in to prevent the price from falling below a certain level. This gradual upward pressure signifies potential strength in the existing uptrend.
Formation and Characteristics
The formation of an Ascending Triangle Pattern involves connecting a series of higher lows with a horizontal line drawn at the resistance level. This creates a tightening range as the highs ascend, forming the triangle. The duration of the pattern can vary, ranging from weeks to months, depending on the timeframe of the chart being analyzed.
Key characteristics of the Ascending Triangle Pattern include diminishing selling pressure and a relatively constant buying interest. This dynamic results in a compression of price action, building potential energy that could lead to a significant breakout.
Interpreting the Ascending Triangle Pattern
Interpreting the Ascending Triangle Pattern involves anticipating a breakout. Traders often look for a decisive move above the horizontal resistance line, signaling a potential upward continuation of the trend. The breakout is considered confirmed when accompanied by increased trading volume, supporting the validity of the move.
Additionally, the height of the triangle can be a useful tool for estimating the potential price target after the breakout. This involves measuring the distance from the initial low to the horizontal resistance line and projecting it upward from the breakout point.
Risk Management
While the Ascending Triangle Pattern is a valuable tool, prudent risk management is crucial. False breakouts can occur, leading to unexpected reversals. To mitigate risks, traders may set stop-loss orders just below the ascending support line, aiming to exit the trade if the pattern fails to hold.
Furthermore, it’s essential to consider broader market conditions, news events, and other factors that may influence the accuracy of the pattern. A holistic approach to risk management ensures a well-rounded strategy.
Examples
Let’s consider a hypothetical scenario where a stock has been in a downtrend for an extended period. The Rounding Bottom starts to form, indicating a potential trend reversal. Traders closely monitor the pattern, looking for a breakout above the resistance level with increased volume. Once the breakout is confirmed, traders may initiate long positions, expecting a bullish trend to follow.
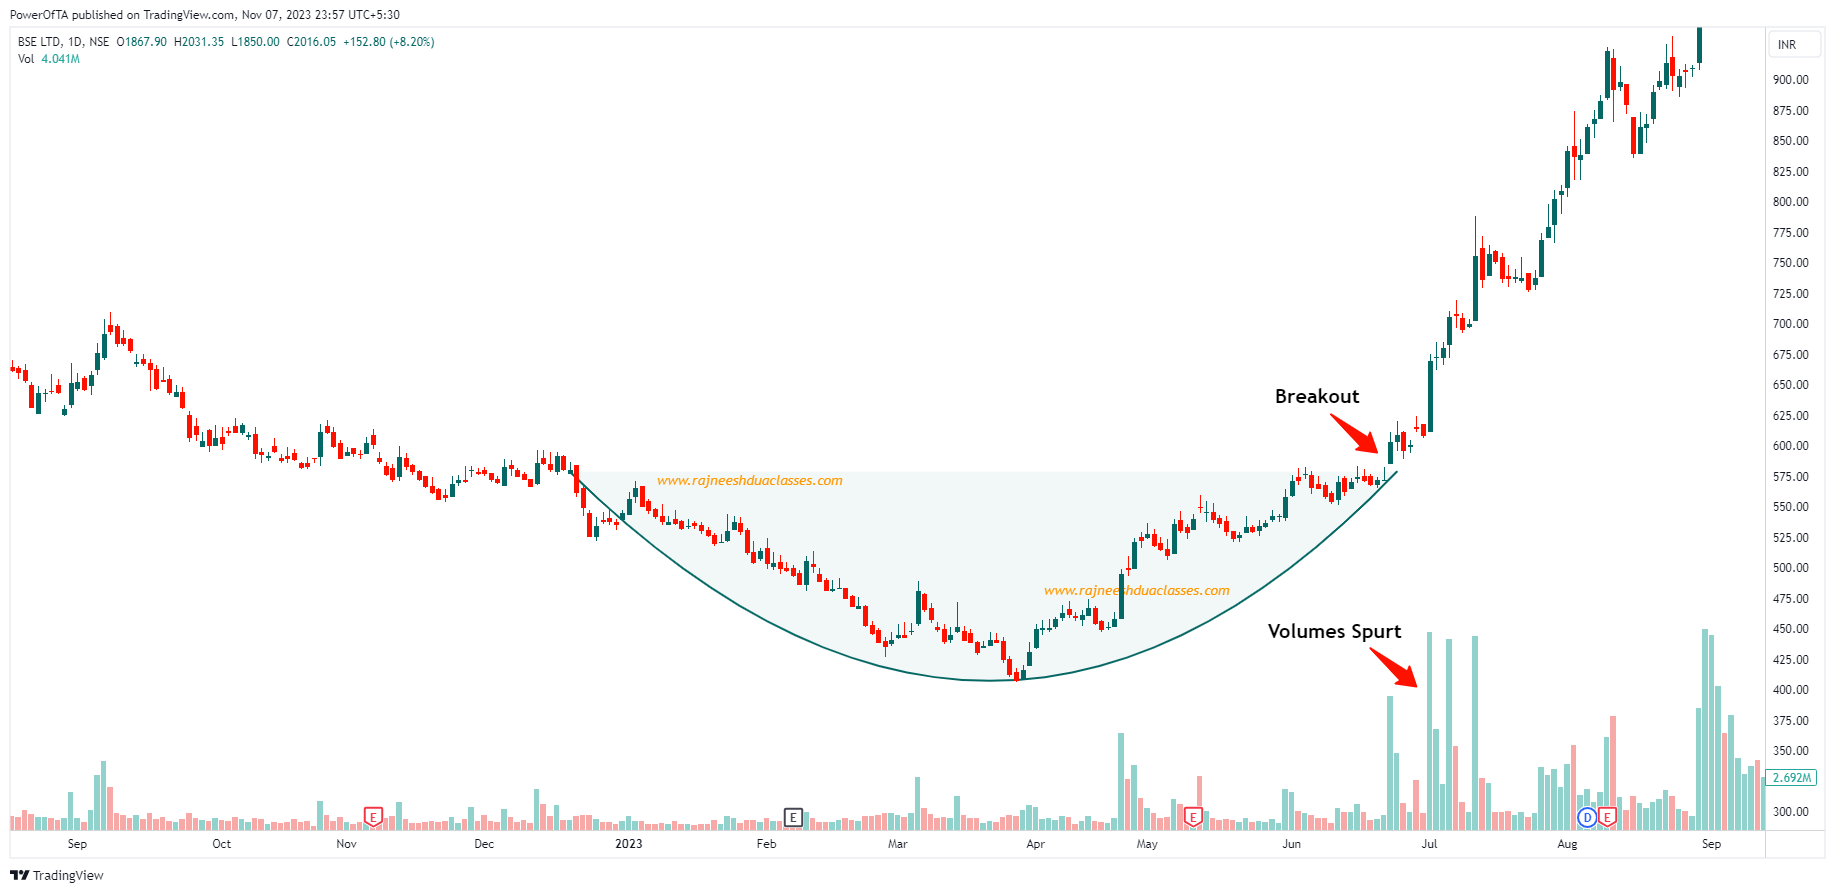
#1 - BSE Ltd.
#2 - Century Textiles Ltd.

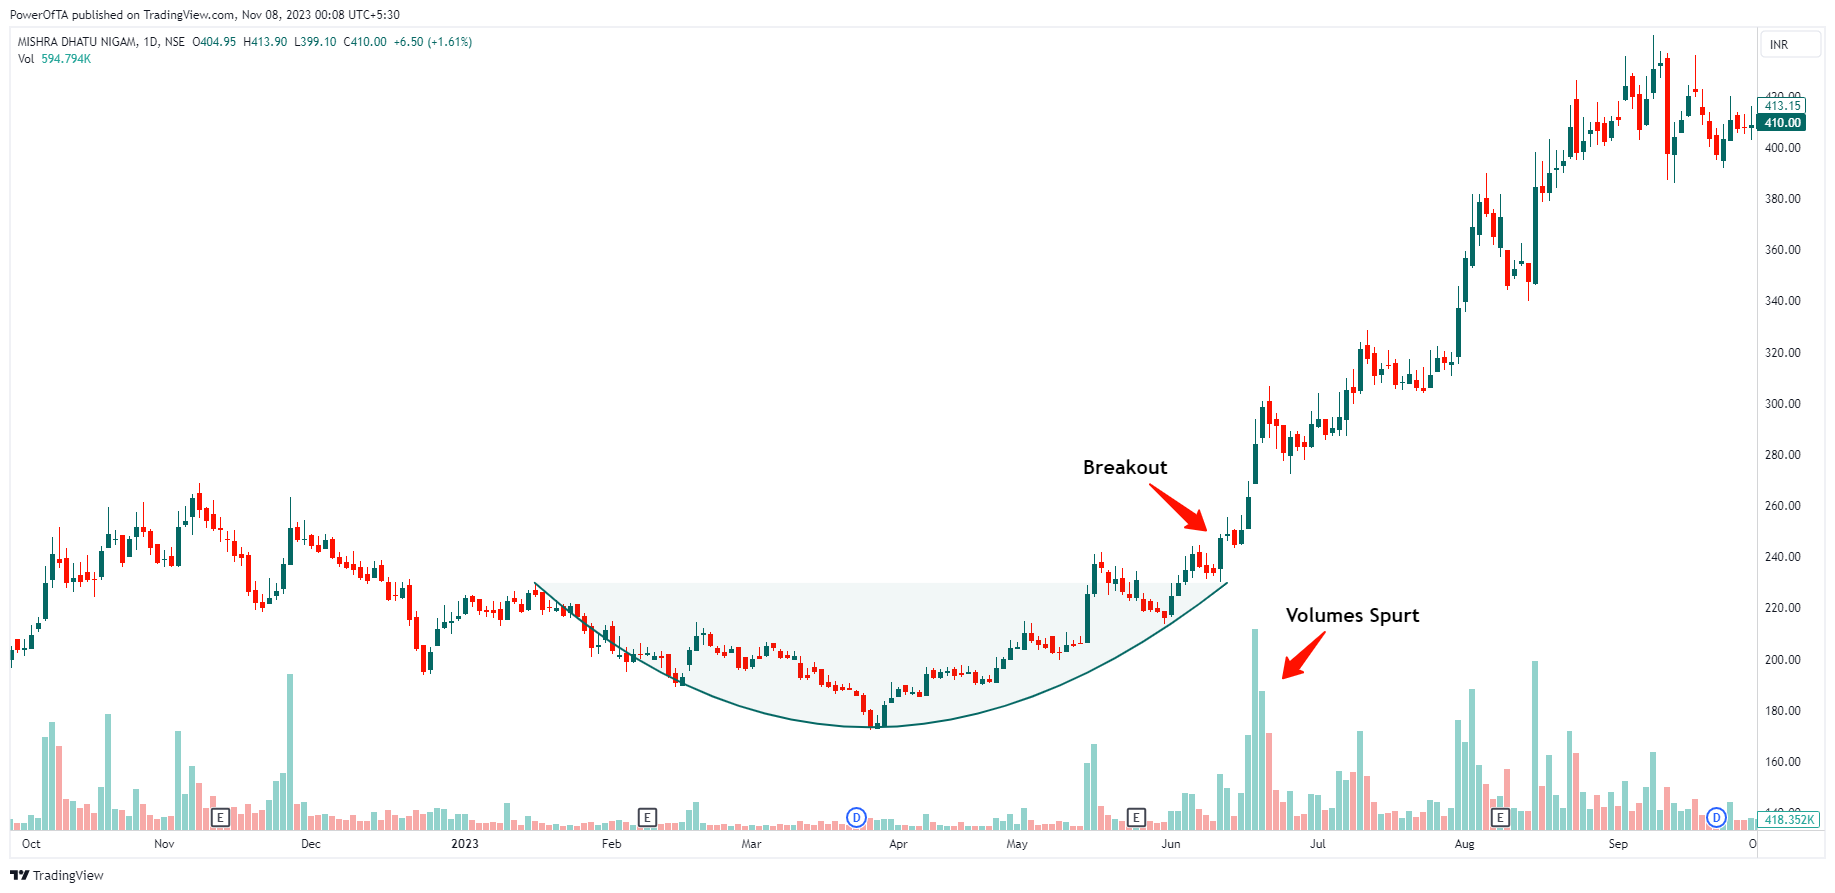
#3 - Midhani Ltd.
Conclusion
In the realm of technical analysis, the Ascending Triangle Pattern stands as a beacon for traders, offering insights into potential bullish continuations. Understanding its formation, interpreting its signals, and implementing effective risk management strategies are key to harnessing its predictive power. As with any tool in the trader’s arsenal, the Ascending Triangle Pattern is most potent when complemented by a comprehensive approach to market analysis. So, next time you spot this triangular masterpiece on a chart, remember that it might just be signaling the next upward surge in price. Happy trading!